Writing
A self-tuning homelab
How I built a self-tuning Kubernetes homelab workflow.
In this article series
3 articles- 01 Building a homelab Kubernetes cluster
- 02 A self-tuning homelab Current
- 03 How I access the services I self-host in my cluster
Every so often, a pull request like this shows up in the rangoonpulse repo.
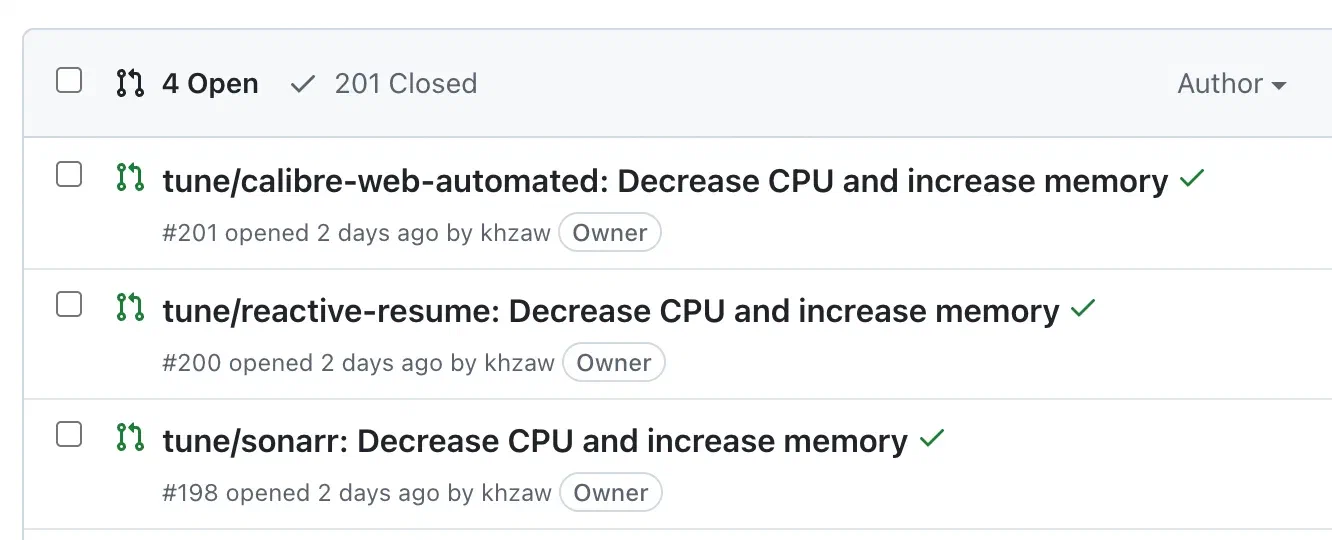
The PR changes a handful of Kubernetes resource requests and limits in the HelmRelease manifests. The description spells out why each change got picked. It shows which containers look underfed, which ones sit on capacity they never touch, and whether the new state still fits on the nodes I actually have. The script does all of that. I review it, merge it, and Flux rolls it out.
Resource constraints
My home cluster is small: a Lenovo m720q mini PC and a Raspberry Pi 4 running 20-30 services between them. Sizing resources in Kubernetes is mostly a guess at first. I know roughly what an app does, give it a round number, and move on. Over time, the cluster drifts. Most pods end up sitting on resource requests they never come close to using, while others run too tight and occasionally get throttled or OOM-killed. In the cloud, the lazy fix is to throw more nodes at it. In a small homelab, the ceiling is the ceiling.
What I built
I already had Prometheus running, so I added a Python tool called resource-advisor. It runs as two Kubernetes CronJobs. A daily job reads Prometheus and writes recommendations into a ConfigMap. A weekly job picks up that report, checks whether the proposed changes still fit, patches the HelmRelease files, and opens a GitHub PR. Kustomize generates the ConfigMap, a stock Python 3.12 Alpine container runs it, and the rest is schedule plus guardrails.
Reading the last couple of weeks
Collecting metrics
Collecting the metrics comes down to two quantile_over_time PromQL queries per container, one for p95 CPU usage and one for p95 memory usage. The script also tracks restart counts over the same window.
cpu_query = (
    f'quantile_over_time(0.95, rate(container_cpu_usage_seconds_total'
    f'{{namespace="{namespace}",pod=~"{pod_regex}",'
    f'container="{container_name}",image!=""}}[5m])'
    f'[{metrics_window}:{metrics_resolution}])'
)

mem_query = (
    f'quantile_over_time(0.95, container_memory_working_set_bytes'
    f'{{namespace="{namespace}",pod=~"{pod_regex}",'
    f'container="{container_name}",image!=""}})'
    f'[{metrics_window}:{metrics_resolution}])'
)
Recommendations
The recommendation logic starts with observed usage, adds a buffer, and keeps any one run from moving too far.
# Target = p95 usage + 30% buffer for requests
target_req_cpu = max(min_cpu_m, cpu_p95_m * 1.30)
target_req_mem = max(min_mem_mi, mem_p95_mi * 1.30)

# Limits get a wider buffer (60%) and a floor relative to requests
target_lim_cpu = max(target_req_cpu * 2.0, cpu_p95_m * 1.60)
target_lim_mem = max(target_req_mem * 1.5, mem_p95_mi * 1.60)

# Cap the per-run adjustment to 25% of current value
rec_req_cpu = recommend(cur_req_cpu, target_req_cpu, max_step_percent=25)
The recommend function clamps the target around the current value.
def recommend(current, target, max_step_percent):
    if current <= 0:
        return target
    step = max_step_percent / 100.0
    low = current * (1.0 - step)
    high = current * (1.0 + step)
    return clamp(target, low, high)
So a container at 100m CPU aiming for 200m does not jump straight there. The first weekly run recommends 125m. The next run can move again if the data still backs it up. I like the slow movement because the metrics need time to settle after a change lands.
I also filter out small differences. If a recommendation is within 10% of the current value, or differs by less than 25m CPU or 64Mi of memory, it is ignored.
Guardrails
I added a few guardrails on top of the recommendations. Restarts are one of them. If a container restarted during the lookback window, the script refuses to cut its memory.
if restart_lookback > 0:
    if rec_req_mem < cur_req_mem:
        rec_req_mem = cur_req_mem
    if rec_lim_mem < cur_lim_mem:
        rec_lim_mem = cur_lim_mem
That rule is blunt. A restart might have nothing to do with memory, but if it came from an OOM kill, shaving memory is exactly the wrong move. CPU is less scary, so the script can still touch it.
I treat a few workloads as bursty. Jellyfin transcoding and Immich’s machine-learning jobs spend a lot of time looking idle, but idle is not really the shape that matters for them. They can still be upsized. They just never get downsized for having a quiet week.
New deployments get the same caution. A normal upsize or downsize needs the full 14 days of data. The exception is memory upsizing after a restart.
The whole mechanism is capped at five changes per week.
Node-fit simulation
The two nodes in my cluster are not interchangeable. The miniPC has far more memory than the Pi, so the heavier workloads belong there.
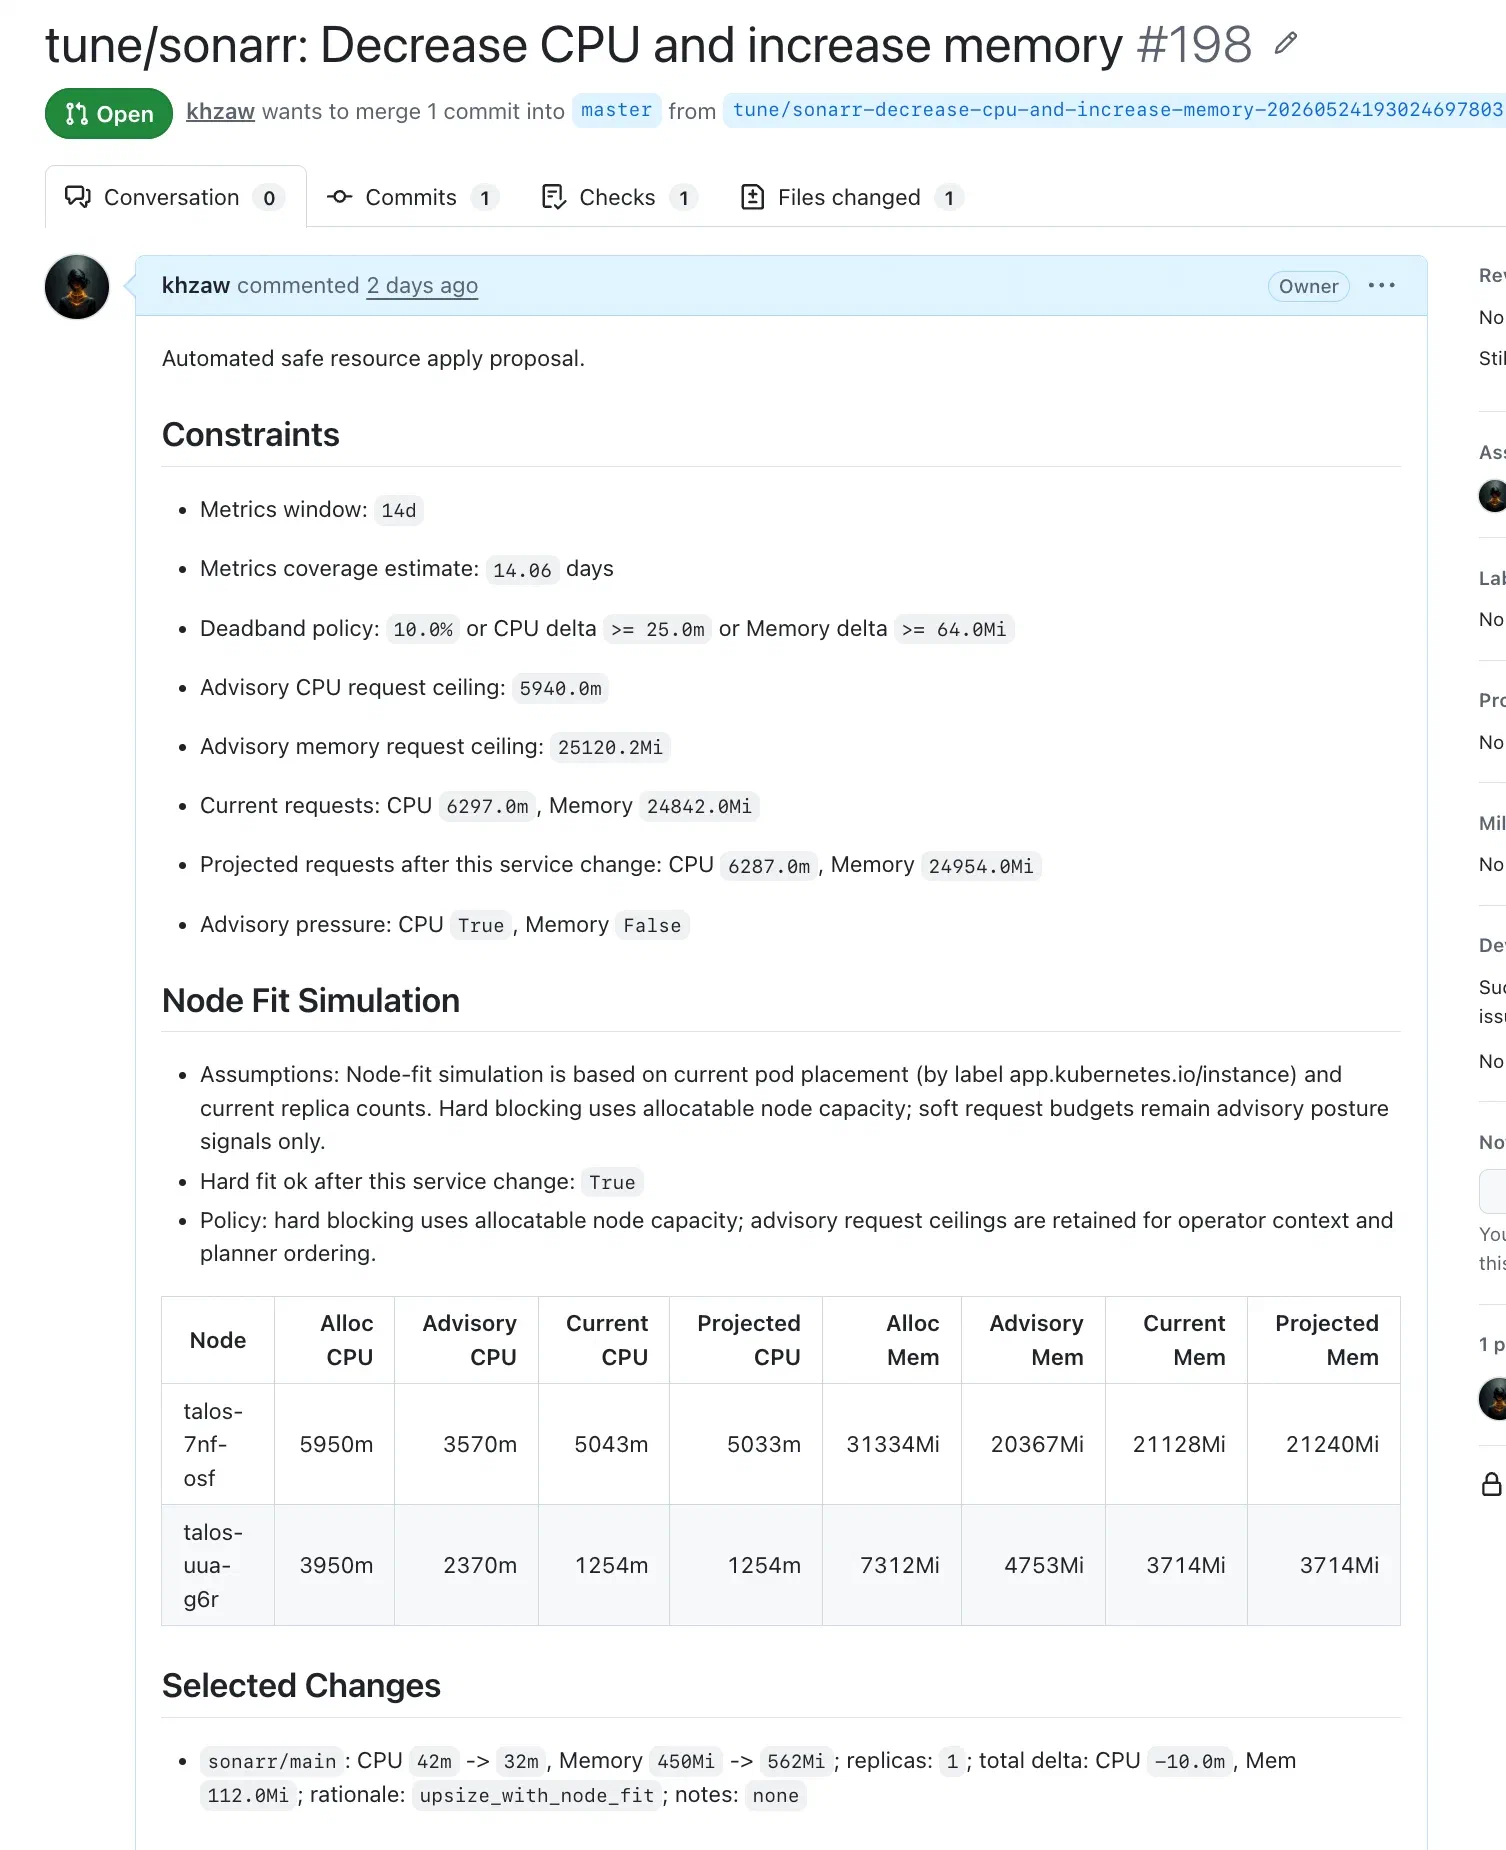
Before the script decides what goes in a PR, it asks the Kubernetes API for live node capacity and current pod placement. Then it checks the projected request totals against a conservative budget. The budget allows no more than 60% of allocatable CPU and 65% of allocatable memory, both cluster-wide and per node.
def check_fit(projected_by_node):
    total_cpu, total_mem = totals(projected_by_node)
    ok = True

    # Cluster-wide budget
    if total_cpu > cpu_budget_m or total_mem > mem_budget_mi:
        ok = False

    # Per-node budget
    for name in node_alloc:
        cpu = projected_by_node[name]["cpu_m"]
        mem = projected_by_node[name]["mem_mi"]
        if cpu > node_cpu_budget[name] or mem > node_mem_budget[name]:
            ok = False

    return ok
That catches the changes that look fine globally but leave one node too tight. The budget is conservative on purpose, since Kubernetes still needs headroom for the kubelet, system daemons, and rollouts. When an upsize doesn’t fit, the planner hunts for downsizes that would free enough room. It scores candidates by the overage they reduce, with extra weight for changes on the same node. Say Jellyfin needs more memory and the miniPC is already near its budget. The PR might pair that upsize with safe cuts to Radarr or Prowlarr. I wanted the tradeoff in the PR itself, not just a note that more memory would be nice.
Patching and PR creation
Almost everything in rangoonpulse is a Flux HelmRelease, so the weekly job has exactly one YAML file to touch per service. Resource requests and limits typically live under values.controllers.main.containers.<name>.resources. The job patches those files on GitHub, creates a branch, commits, and opens a PR.
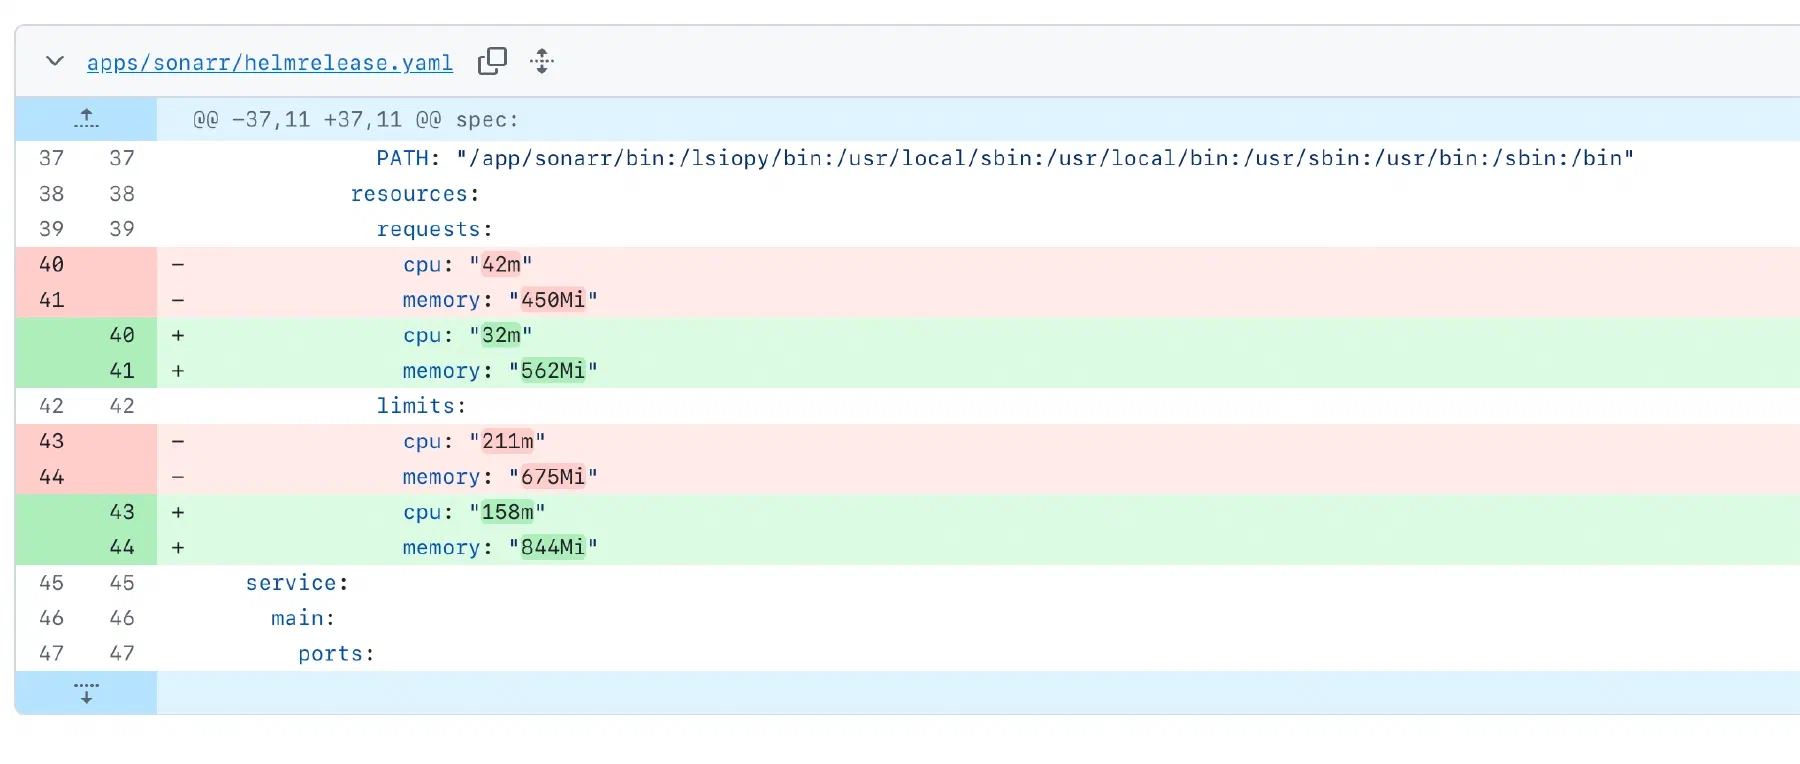
The PR body carries the policy constraints, a node-fit table, the selected changes, and the candidates it skipped. I wrote it for tired-maintenance-me, not for the script that generated it.
Once I merge, Flux reconciles the new HelmRelease values and the pods roll out with the updated resources. The next daily run starts from the new baseline, and the loop starts over.
Observability
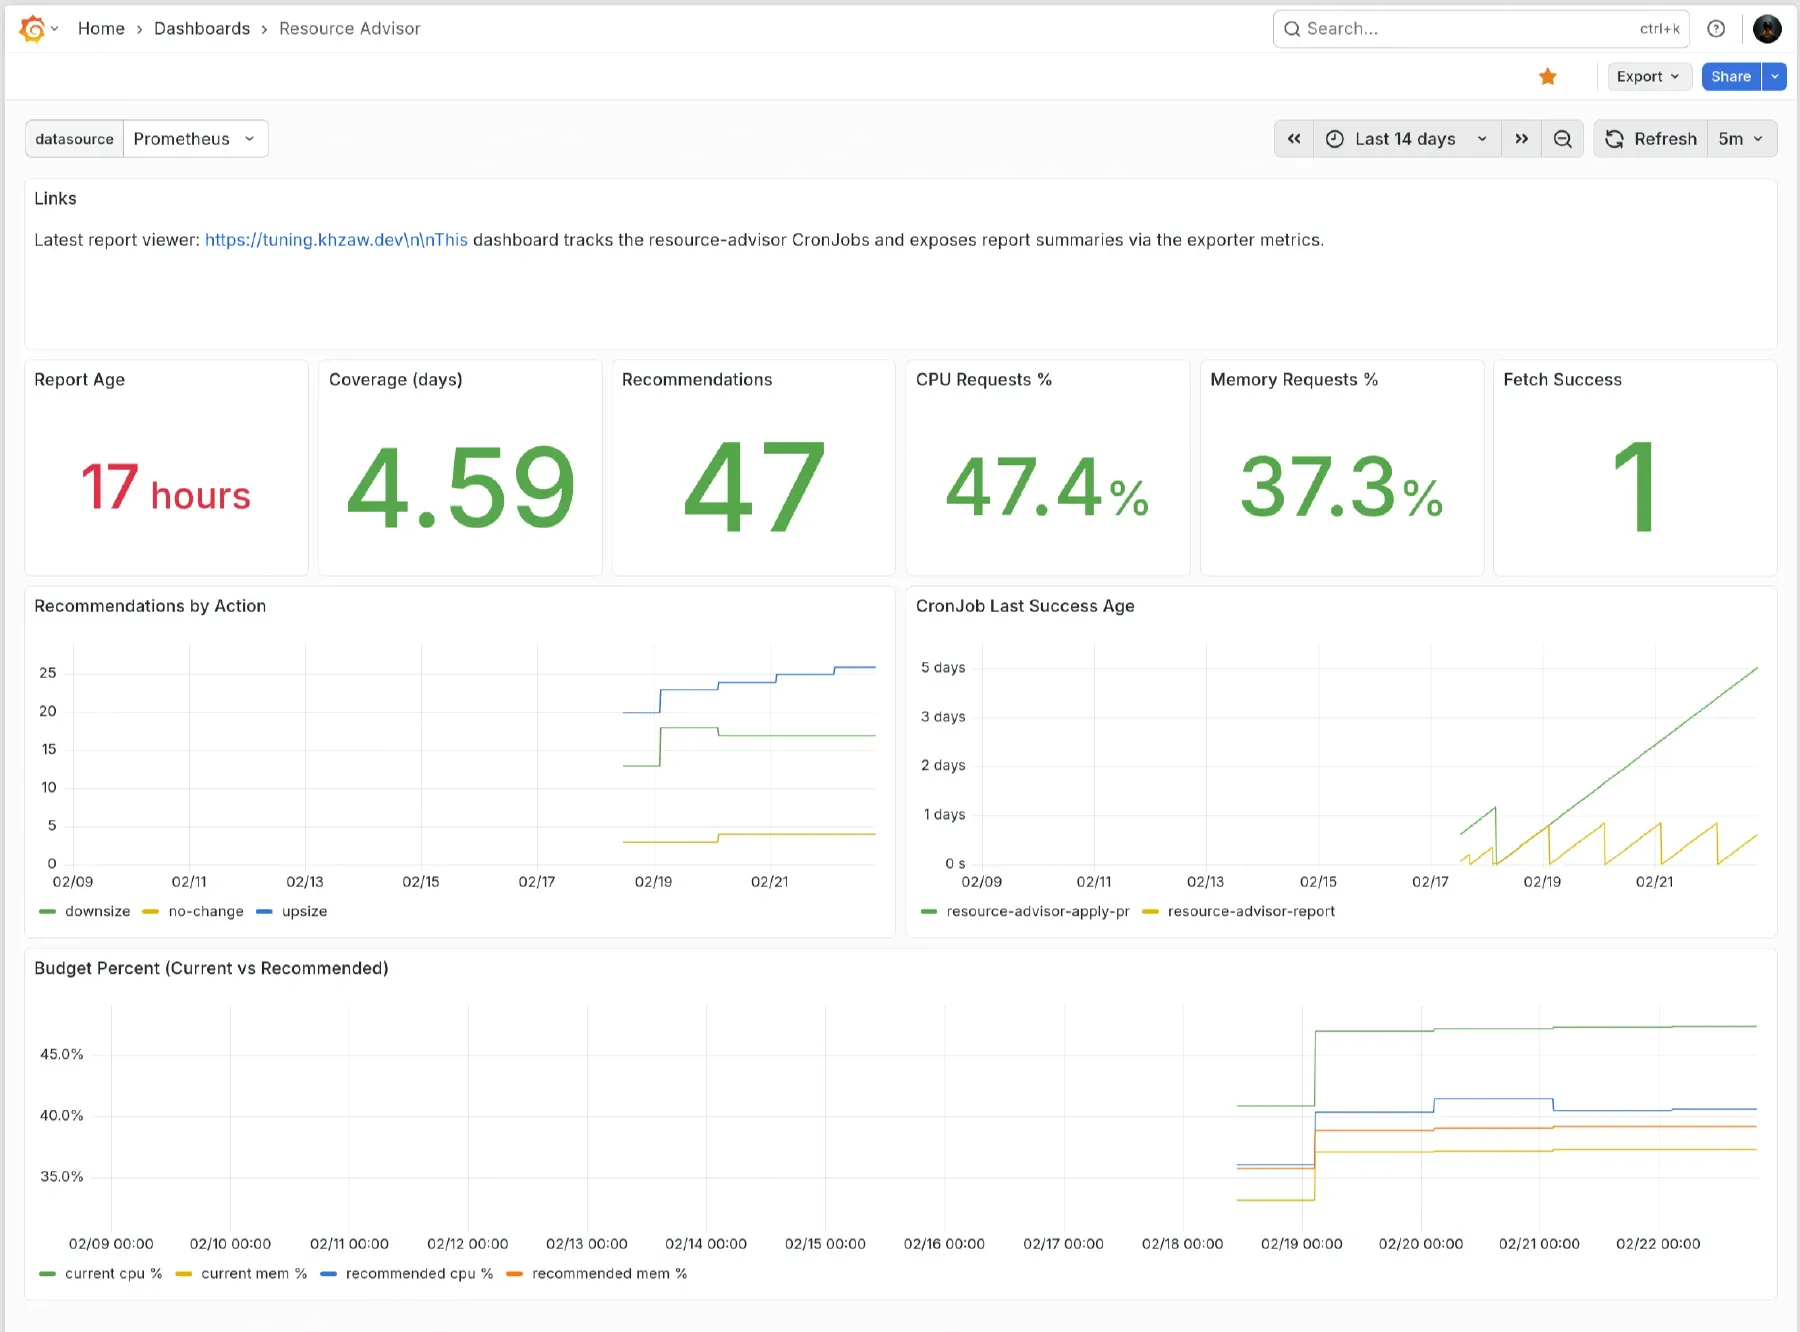
A small exporter deployment polls the report ConfigMap and serves a readable summary, plus Prometheus metrics for recommendation counts, upsize/downsize actions, and current request utilization as a percentage of allocatable capacity.
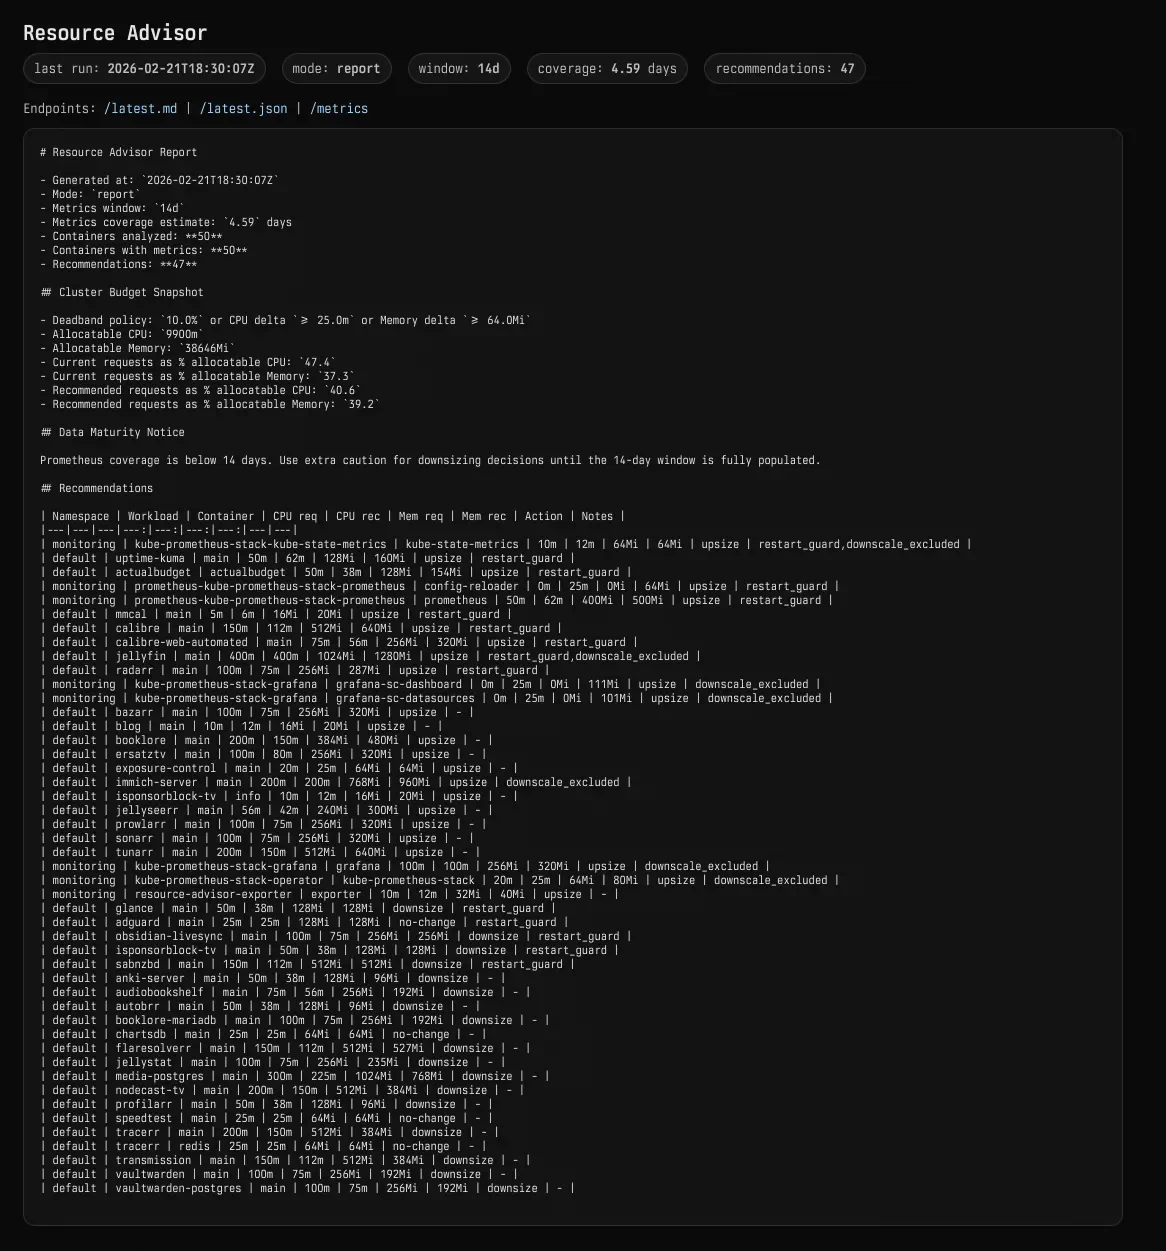
Those feed a Grafana dashboard. I mostly watch the trend. If budget utilization keeps creeping up, I see it there before it turns into a scheduling problem.
Why not VPA?
Before I built this, I looked at Vertical Pod Autoscaler, but it didn’t fit how I run this cluster.
In Auto mode, VPA restarts pods to apply changes, which is rough on stateful or interactive services. It works at the workload level too, rather than planning around my capacity budgets and node placement. The dealbreaker for me is that it mutates live resources, which fights the GitOps model I use everywhere else.
I wanted the slower thing with a paper trail. A PR is less automatic than a controller, but it hands me the diff, the reason, and the freedom to say no to the change.
Results
It has been running for a few weeks, and so far it has gone pretty well. Some of the *arr services were holding resource requests they never came close to using. Jellyfin and a few heavier services needed more care, and the restart guard caught them before the script tried to “optimize” in the wrong direction. Because every change is capped, values settle over a few cycles instead of lurching after one sample window.
The payoff is more boring than the name suggests, and I am pretty happy with that. One Python file, a few RBAC manifests, and two CronJobs cover the whole thing. For this homelab, that is about the right amount of machinery.
In this article series
3 articles- 01 Building a homelab Kubernetes cluster
- 02 A self-tuning homelab Current
- 03 How I access the services I self-host in my cluster